
Stablecoin Payments Revenue Calculator: How Stablecoins Can 5x Revenue for Payments Platforms
Stablecoins can 5x revenue for payments platforms. Learn how and see your platform's potential revenue lift with our stablecoin payments revenue calculator.

Stablecoins are poised to reshape payments, especially with the recent passing of the GENIUS Act. Stripe is launching its own blockchain to act as a global payments network, PayPal has issued its own stablecoin, and credit card giant Visa is rolling out support as well.
Why? Because stablecoins strip out the middlemen. By issuing their own stablecoin, payments platforms can earn more revenue, charge users less, and earn yield on the dollars backing their coin. The flywheel becomes even more transformative if payments platforms issue the stablecoin on their own chain.
We’ll show you how below with a breakdown of how stablecoins lift revenue and reduce fees leaked to third parties, including the formula you can use to understand the bottom line impact for your payments platform.
Run the numbers for your platform now with our stablecoin payments revenue calculator!
Payments fees today: How much goes to middlemen?
Intermediary fees are a problem for payments platforms everywhere. Let’s break down the percent of payments volume that different types of platforms leak to different middlemen on average.
Card-based payments: 1.5-2.5% leaked to middlemen on average
Middleman fees include:
- Interchange fees
- Card network fees
- Acquirer, gateway, and 3-D secure fees (if not in-house)
Bank rails-based payments: 0.1 to 0.5% leaked to middlemen on average
Middleman fees include:
- Operator fees
- Risk fees
- Funding and settlement liquidity costs
International payments: 3-6% leaked to middlemen on average
Middleman fees include:
- SWIFT message fees
- Correspondent banking fees
- Receiving bank fees
- FX spread
- Nostro pre-funding
Payments fees with stablecoins: Moving onchain eliminates middlemen
Fees associated with legacy payments come from middlemen necessary to connect the different systems involved – banks, clearinghouses, routing networks, and more. Stablecoin payments don’t need those middlemen because they rely on one simple network – a blockchain – to move funds between users.
And best of all: You can own the entire network and all of the value it creates by issuing a stablecoin on your own dedicated chain. As chain owner, you get to set the transaction fees – also known as gas fees – and collect them as revenue.
Your expenses would depend on the exact model you use for your chain. If you launch your chain as an L2 on top of Ethereum (the same model Robinhood is using for stock tokenization), your primary onchain expense is data availability (DA), which is the is the fee to publish your chain's compressed transaction data to Ethereum, so it’s permanently available for verification. DA costs scale with the number of individual transactions, and not volume, based on the amount of data each transaction commits to Ethereum. In other words, a $100,000 transaction would cost the same as a $1 transaction. There is, however, variability in DA costs depending on how much data other chains are committing to Ethereum at any given time. [1]
In practice, DA costs should work out to under 0.005% of transaction volume for the average payments chain. This is a conservative estimate based on the most expensive DA solution, which our research places at $20.56 per MB of transaction data on average. The average L2 transaction takes roughly 150 bytes in data, or 0.00015 MB, which works out to $0.003 (one third of one cent) per transfer. Analysts estimate the average Venmo transaction size at $65 to $75 – if we use the midpoint figure of $70 per transaction, that would put DA costs at 0.0044% of volume. It's important to keep in mind that DA costs as a share of volume fall for networks with larger average payment sizes, highlighting stablecoins’ value for business-to-business transactions and international transactions, which tend to be bigger.
Stablecoin yield: A new revenue source
A payments platform with its own stablecoin would also be able to capture yield on the dollars backing the stablecoin by investing it into U.S. treasury bills or a similarly stable instrument. With current one-year yields between 4 and 5%, this would give stablecoin-based payments platforms another significant revenue source alongside transaction fees — in many cases, a bigger revenue source.
The new payments revenue formula with stablecoins
Stablecoin payments revenue calculator
Add your numbers to see the potential revenue lift from stablecoins for your platform on the calculator below! We automatically calculate projected DA costs based on total volume and average payment size.
Payments Revenue Calculator: Legacy System vs. Stablecoin Chain
Your payments volume
Legacy model
Stablecoin model
Revenue under legacy model
—
Revenue under stablecoin model (excl. reserves yield)
—
Revenue from reserves yield
—
Total revenue under stablecoin model
—
Talk to a Conduit expert about how to transition to stablecoin payments.
The payments revenue formula explained
Let’s break down the economics of a stablecoin-based payments chain versus a legacy payments platform.
The legacy payments revenue formula:
Revenue = (your_fee_percentage * volume) - (middleman_fee_percentage * volume)
The stablecoin payments revenue formula:
Revenue = (gas_fee_percentage * volume) - (DA_fee_percentage * volume) + (treasury_yield * your_stablecoin_marketcap)
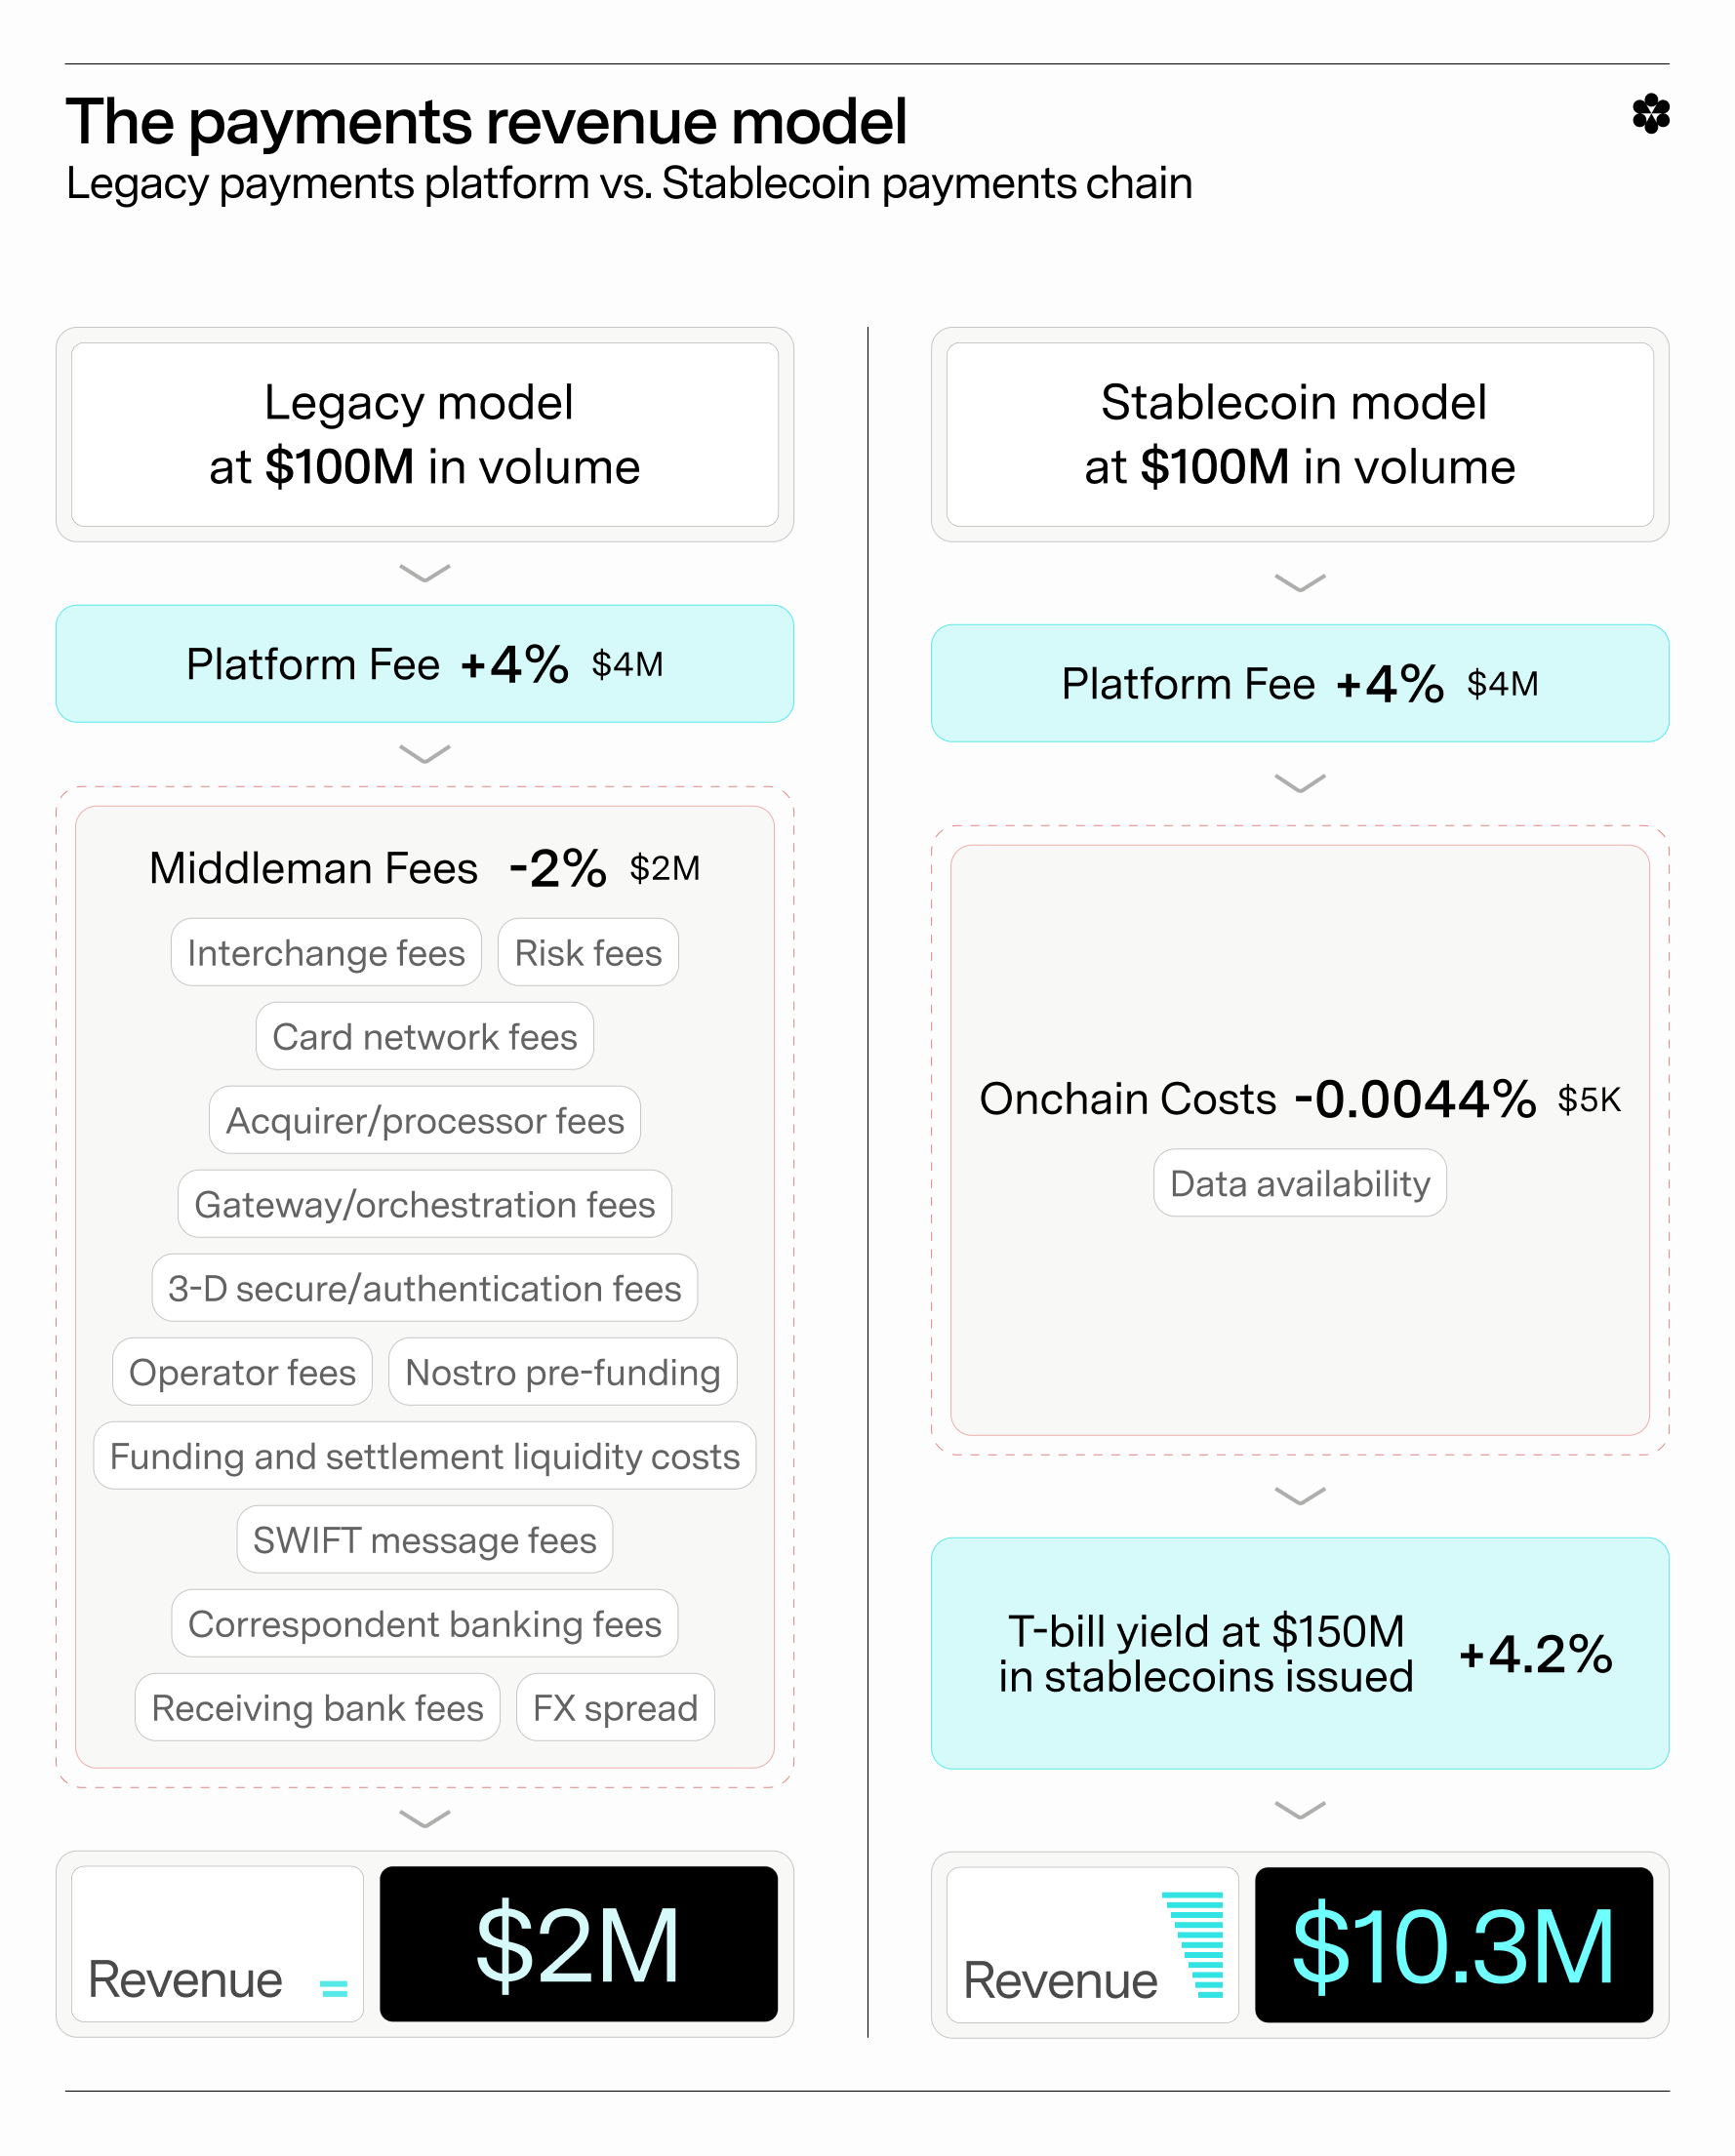
So, imagine a card-based payments platform doing $100 million in volume and charging users a 4% fee and paying 2% of volume to middlemen, that transitions from the legacy model to the stablecoin model, issuing $150 million of its own stablecoin.
Under the legacy model, its revenue is:
(0.04 * $100M) - (0.02 * $100M) = $2M
Under the stablecoin model, its revenue is:
(0.04 * $100M) - (0.000044 * $100M) + (0.042 * $150M) = $10.3M
The stablecoin model leads to over 5x the revenue! Even a payments platform that didn’t launch its own stablecoin and get treasury bill yield would see a 50% increase in revenue (total of $4 million in this example).
This is a fundamental change in unit economics. Under the stablecoin model, the platform could pass savings on to users, and charge significantly lower fees to capture more market share. Imagine the platform above knocks fees down to 1%, leading to a 20% increase in usage. That would work out to revenue of $7.5 million – still more than 3x higher than the legacy model, with huge savings for customers and stronger user experience.
A new era for payments
There’s already proven demand for stablecoins as a payments mechanism around the world, even without regulatory clarity and with users forced to use unwieldy, self-hosted crypto wallets. The passing of the GENIUS Act means legacy payments platforms with established trust and customer bases can embrace stablecoins and incorporate them into their existing, user-friendly platforms. Those that do have a chance to drastically improve their business models with significantly lower costs and new revenue sources.
Want to explore stablecoins for your payments platform? Contact Conduit to learn more.
End note:
[1] Payments networks could also launch an L1 chain instead of an L2, though this would likely require more engineering work and may not perform as well, or as cost-effectively. An L1 chain operator would need to bootstrap a validator network, which can cost a significant share of the chain's fee revenue. You can read more about the differences between L1s and Ethereum L2s from the chain owner perspective here. Alternatively, you could forego building a chain and simply launch an app on an existing blockchain, but this would mean you and your users have to pay gas fees – we analyze gas fee levels for apps on several chains here.